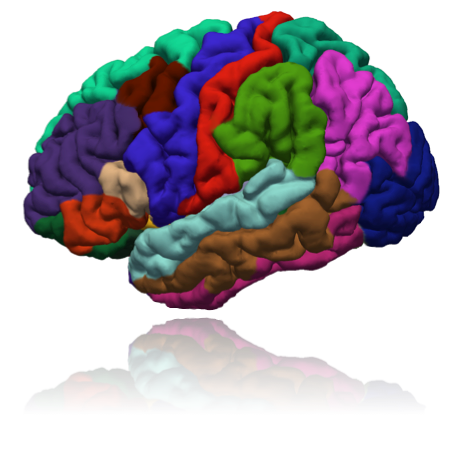
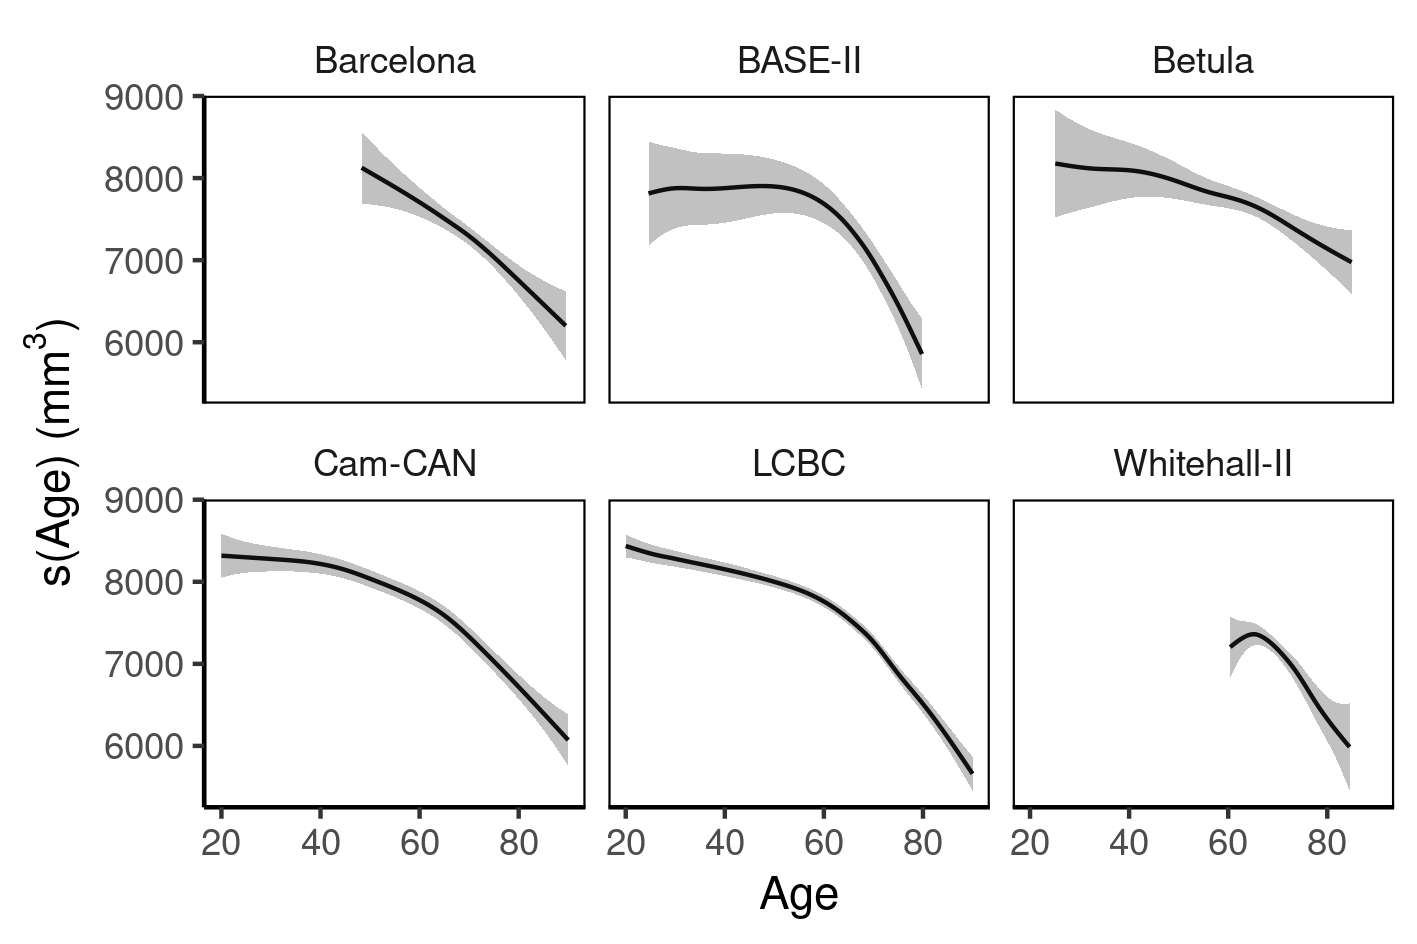
class: middle, right, title-slide # Meta-Analysis of Generalized<br>Additive Models ## … and other nonlinear models ### Øystein Sørensen, University of Oslo ### ERUM2020 --- layout: true <div class="my-sidebar"></div> --- <style type="text/css"> .remark-slide-content { font-size: 30px; padding: 1em 4em 1em 4em; } </style> # Motivation - Combining data from multiple studies crucial for scientific progress, particularly with high-dimensional data, e.g. in - Brain imaging - Genetics - Increased statistical power and predictive accuracy ??? statistical power consortia --- # Motivation - Data sharing challenging in practice, e.g. - Privacy - Participants' consent - Different data formats --- # Circumventing the Problem - Let each group `\(g\)` fit a model to their data `$$y = \hat{\beta}_{0,g} + \hat{\beta}_{1,g}x_{1} + \epsilon$$` - Share the parameters, not the data -- - Find joint estimates `$$\hat{\beta}_{1} = \sum_{g=1}^{G} w_{g}\hat{\beta}_{1,g}$$` --- # Problem - Meta-analytic methods require parameters, with identical interpretation across studies - Many problems require semiparametric methods more able to estimate nonlinear effects `$$y = \beta_{0} + f(x) + \epsilon$$` -- - How do we combine `\(\hat{f}_{g}(x)\)` from `\(g\)` different groups? --- # Problem - Generalized additive model `$$\hat{f}_{g}(x) = \sum_{k=1}^{K} \hat{\alpha}_{k,g}b_{k,g}(x)$$` - Basis functions often need depend on the range of `\(x\)`, and need to be different between groups: - Spline weights `\(\hat{\alpha}_{k,g}\)` not comparable --- # Brain Imaging Example .pull-left[ - How is sleep quality associated with lifespan development of hippocampus? ] .pull-right[  ] --- # Brain Imaging Example .pull-left[ - Six European partners - Each fit a model like `$$y = \hat{f}_{1,g}(a) + \hat{f}_{2,g}(a,x) + \epsilon$$` - Effect of age `\(\hat{f}_{1,g}(a)\)` - Effect of sleep `\(\hat{f}_{2,g}(a,x)\)` ] -- .pull-right[ - `\(\hat{f}_{1,g}(a)\)` from each group:  ] --- # Pointwise Meta-Analysis - Each group shares a **function** which returns predictions from `\(\hat{f}_{g}(x)\)`. - Need point estimates and covariance matrix of spline weights, and basis functions. - Meta-analytic estimate `$$\hat{f}(x) = \sum_{g=1}^{G} w_{g}\hat{f}_{g}(x)$$` - Weights `\(w_{g}\)` based on standard errors. .footer[All details in Sørensen et al. (2020), https://arxiv.org/abs/2002.02627] --- # Pointwise Meta-Analysis in R - Each group does something like this: ```r library(mgcv) mod_g <- gam(y ~ s(x1) + s(x2) + x3, data = dat) ``` -- - Meta-analysis amounts to combining predictions obtained with ```r pred_g <- predict(mod_g, newdata = common_grid, se.fit = TRUE) ``` -- - But `mod_g` is full of individual participant data!! - Actual data, transformed values, factor levels, etc. --- # The metagam Package - Step 1 - Still start by fitting a model ```r mod_g <- gam(y ~ s(x1) + s(x2) + x3, data = dat) ``` - Use `strip_rawdata()` to keep only what you need to `predict()` ```r library(metagam) mod_g_safe <- strip_rawdata(mod_g) ``` - S3 method, currently works for `mgcv::bam()`, `mgcv::gam()`, `mgcv::gamm()`, `gamm4::gamm4()`. --- # The metagam Package - Step 2 - Combine models from each location, stripped for rawdata: ```r # List of models fitted by each group models <- list(mod_1, mod_2, mod_3) ``` - Compute meta-analytic estimate: ```r metafit <- metagam(models, grid = common_grid) ``` ??? Lots of available options for type of meta-analyis, p-values, terms to combine, grids, etc. --- # Back to Brain Imaging Example .pull-left[ - Lifespan hippocampus volume <img src="figures/metafit1.png" height="350"> ] .pull-right[ - Effect of sleep <img src="figures/metafit2.png" height="350"> ] --- # metagam: Post-Fit Analysis - Model summary ```r summary(metafit) ``` - Plot individual functions and meta-analytic estimate ```r plot(metafit) ``` --- # metagam: Dominance Plots .pull-left[ - How much does each model contribute? ```r plot_dominance(metafit) ``` ] .pull-right[ <img src="figures/relative_influence.png", height="450"> ] --- # metagam: Heterogeneity Plots .pull-left[ - How different are the estimated functions? ```r plot_heterogeneity(metafit) ``` ] .pull-right[ <img src="figures/heterogeneity.png", height="450"> ] --- # Summary ### The metagam package offers - Distributed fitting of generalized additive models. - Removal of rawdata from model objects. - Meta-analytic combination of fits, close to what would be obtained with access to the complete data. - Convenience functions for visualization and statistical summaries. --- # Other Application Areas - Customer analytics - Methods may be relevant for businesses with subsidiaries in different countries/regulatory areas? -- - `strip_rawdata()` reduces memory load when fitting a large number of models. - Meta-analytic approach overcomes data harmonization challenges, even when data in principle can be combined. - If data is too large for memory, `metagam` can be used to combine fits to different subsets. --- # Future Directions .pull-left[ - Extension to other classes of nonlinear models. - Bayesian simulation from joint posterior. - New algorithm for computation of `\(p\)`-values. ] .pull-right[ <img src="figures/metagam_logo.png", height="300"> https://lifebrain.github.io/metagam/ ] --- # Thanks! - Co-developers: Andreas M. Brandmaier and Athanasia Mo Mowinckel <img src="figures/lifebrain.png", height="200"> - The Lifebrain project is funded by the EU Horizon 2020, Grant agreement number: 732592. - Presentation created with `xaringan`.